9
Phase Change and Property Diagrams
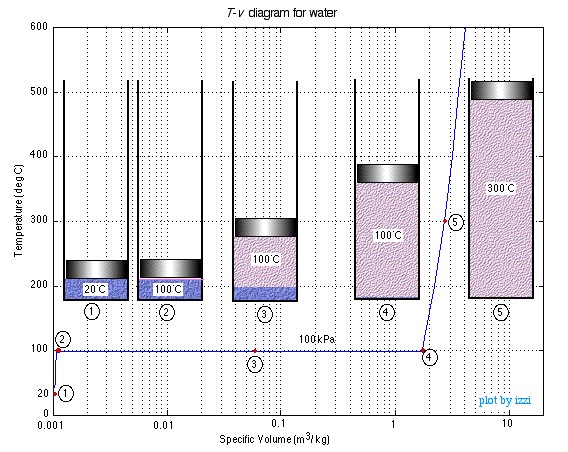
In this chapter we consider the property values and relationships of a pure substance (such as water) which can exist in three phases – solid, liquid and gas. We will not consider the solid phase in this course.In order to introduce the rather complex phase change interactions that occur in pure substances we consider an experiment in which we have liquid water in a piston-cylinder device at 20°C and 100kPa pressure. Heat is added to the cylinder while the pressure is maintained constant until the temperature reaches 300°C, as shown in the following T-v diagram (temperature vs specific volume):
![]()
![]()
![]()
From State (1) to State (2) the water maintains its liquid phase and the specific volume increases very slightly until the temperature reaches close to 100°C (State (2) – Saturated Liquid). As more heat is added the water progressively changes phase from liquid to water vapor (steam) while maintaining the temperature at 100°C (Saturation Temperature – Tsat) until there is no liquid remaining in the cylinder (State (4) – Saturated Vapor). If heating continues then the water vapor temperature increases (T > Tsat) and is said to be in the Superheated (State (5)).
Notice that during this entire process the specific volume of the water increased by more than three orders of magnitude, which made it necessary to use a logarithmic scale for the specific volume axis.
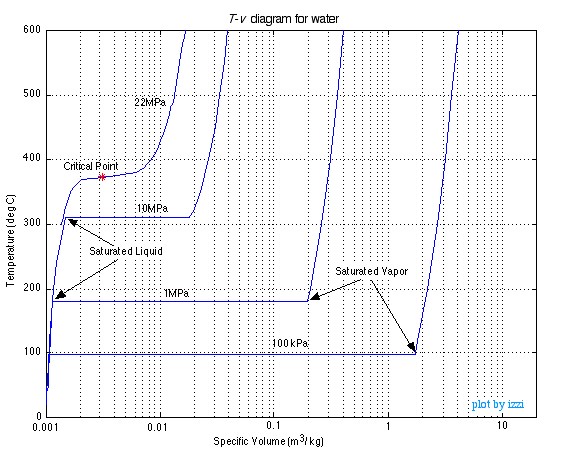
We can repeat this same experiment at different pressures to attain more curves as shown in the figure below.
![]()
![]()
![]()
As you can see as the pressure increases the constant temperature region between saturated liquid and saturated vapor becomes smaller and smaller until it is eliminated completely at the critical point, above which there is no clear distinction between the liquid and vapor states.
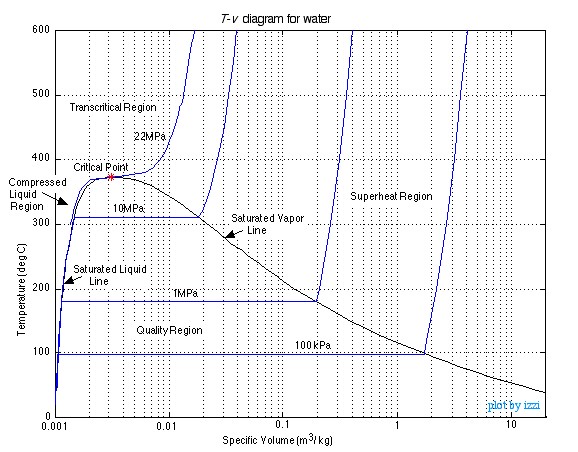
Saturation lines can be drawn by connecting the loci of the saturated liquid and saturated vapor points as shown in the figure below.
![]()
![]()
![]()
The saturation lines define the regions of
interest as shown in the diagram, being the Compressed Liquid region to
the left, the Quality region enclosed by the saturation lines, and the Superheated
region (which also includes the Transcritical region) to the right of
the saturated vapor line and above the critical point. We will use Property
Tables associated with the regions in order to evaluate the various
properties. Notice that we have provided property tables of steam, Refrigerant
R134a, and Carbon Dioxide, which due to environmental concerns involving R134a
is likely to become the refrigerant of common usage in the future.
Quality Region
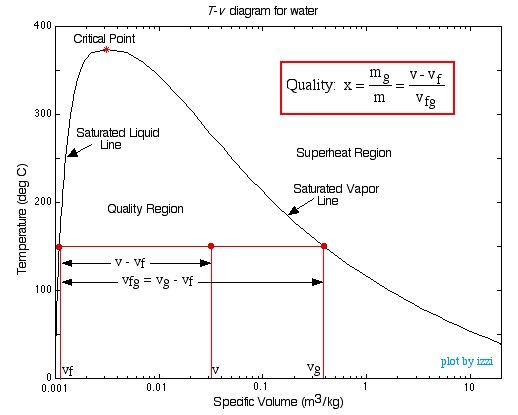
The Quality Region, also referred to as
the Saturated Liquid-Vapor Mixture Region, is the area enclosed between
the saturated liquid line and the saturated vapor line. At any point within
this region the quality of the mixture (sometimes referred to as the dryness
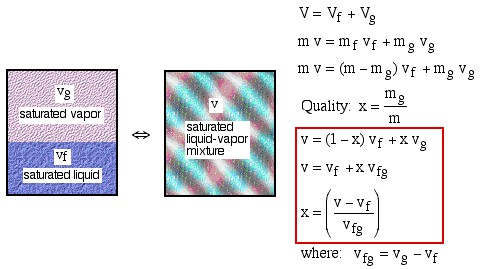
factor) is defined as the mass of vapor divided by the total mass of the fluid,
as shown in the following diagram:
![]()
![]()
![]()

![]()
![]()
![]()
![]()
![]()
Notice that properties relating to the saturated liquid have the subscript f, and those relating to the saturated vapor have the subscript g. In order to evaluate the quality consider a volume V containing a mass m of a saturated liquid-vapor mixture.
![]()
![]()
![]()
![]()
![]()
![]()
![]()
![]()
![]()
![]()
![]()
Notice from the steam property tables that we have also included three new properties: internal energy u [kJ/kg], enthalpy h [kJ/kg], and entropy s [kJ/kg.K] all of which will be defined as needed in future sections. At this stage we note that the 3 equations relating quality and specific volume can also be evaluated in terms of these three additional properties.
The P-v Diagram for Water
The above discussion was done in terms of the
temperature (T) and specific volume (v). You may recall from Chapter 1 when we
defined the State Postulate however, that any two independent intensive
properties can be used to completely define all other intensive state
properties. This means we can also evaluate a substance in terms of Pressure
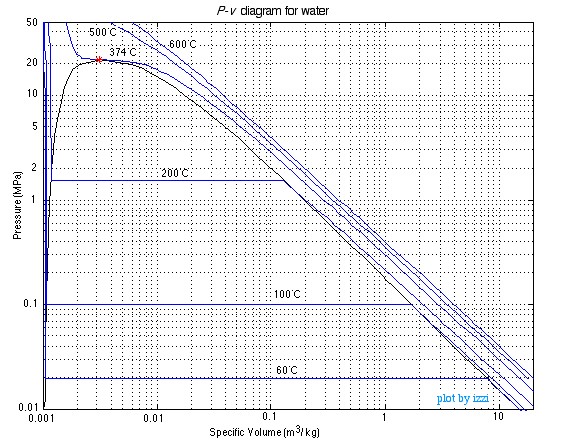
(P) and specific volume (v) as shown below:
![]()
![]()
![]()
Notice that because of the extremely large range of pressure and specific volume values of interest, this can only be done on a log-log plot. This is extremely inconvenient, so both the T-v and the P-v405 diagrams are normally not drawn to scale, however are sketched only in order to help define the problem, which is then solved in terms of the steam tables. This approach is illustrated in the following solved problems.
Solved Example
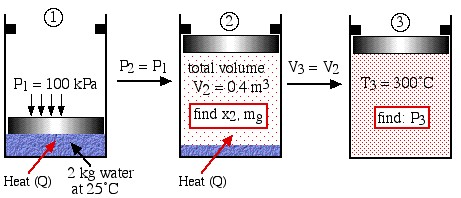
Two kilograms of water at 25°C are placed in a piston cylinder device under 100 kPa pressure as shown in the diagram (State (1)). Heat is added to the water at constant pressure until the piston reaches the stops at a total volume of 0.4 m3 (State (2)). More heat is then added at constant volume until the temperature of the water reaches 300°C (State (3)). Determine (a) the quality of the fluid and the mass of the vapor at state (2), and (b) the pressure of the fluid at state (3).
![]()
![]()
![]()
![]()
![]()
![]()
![]()
![]()
![]()
Step 1: Always draw a complete diagram of the states and processes of the problem and include all the relevant information on the diagram. In this case there are three states and two processes (constant pressure and constant volume).
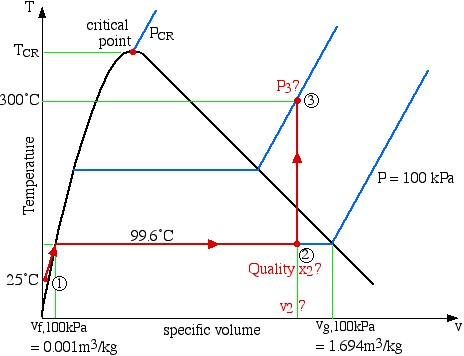
Step 2: In the case of a closed system with a phase change fluid, always sketch a T-v or P-v diagram indicating all the relevant states and processes on the diagram. As mentioned above this diagram will not be drawn to scale, however it will help to define the problem and the approach to solution. In the case of steam, as we determine various values from the steam tables we add these values to the diagram, typically as shown below:
![]()
![]()
![]()
![]()
![]()
![]()
![]()
![]()
![]()
![]()
![]()
Notice that the T-v diagram is based exclusively on intensive properties, hence mass is not indicated on the diagram. Thus we indicate on the diagram that in order to determine the quality at state (2) we need to first evaluate the specific volume v2, which can then be compared to the saturation values vf and vg at the pressure of 100 kPa.
Thus ![]() =
= ![]() = 0.2
= 0.2 ![]()
Quality ![]()
mass of water vapor at state 2:
![]()
Concerning state (3), the problem statement did not specify that it is in the superheat region. We needed to first determine the saturated vapor specific volume vg at 300°C. This value is 0.0216 ![]() , which is much less than the specific volume v3 of 0.2
, which is much less than the specific volume v3 of 0.2 ![]() , thus placing state (3) well into the superheated region. Thus the two intensive properties which we use to determine the pressure at state (3) are T3 = 300°C, and v3
, thus placing state (3) well into the superheated region. Thus the two intensive properties which we use to determine the pressure at state (3) are T3 = 300°C, and v3![]() . On scanning the superheat tables we find that the closest values lie somewhere between 1.2 MPa and 1.4 MPa, thus we use linear interpolation techniques to determine the actual pressure P3 as shown below:
. On scanning the superheat tables we find that the closest values lie somewhere between 1.2 MPa and 1.4 MPa, thus we use linear interpolation techniques to determine the actual pressure P3 as shown below:
![]()
![]()
![]()
![]()
![]()
![]()
![]()
Solved Real World Example
When boiling food the cooking temperature is limited to about 100° C (depending on elevation). Pressure cookers allow for faster cooking by increasing the boiling temperature of water using increased pressure. The pressure within the sealed cooker can be varied by using different weights to seal the vent. A pressure cooker containing 4kg of water is to be used to cook potatoes at 150° C determine (a) what pressure in necessary to maintain the desired boiling temperature and (b) the mass of the weight that must be used in order to maintain the pressure determined in part (a) given a round vent with a diameter of 1cm, (c) if the pressure cooker has a volume of 10L what is the quality of the steam within the pressure cooker the instant it reaches temperature, before any steam is vented (assuming all air has been purged from the cooker by this point) , and (d) how long can the potatoes be cooked at the desired temperature before all the water is boiled away if heat is being added to the system by a 7000 Watt burner.
Step 1
In order to maintain a consistent temperature we know we want a pressure that will place the boiling point of the water at exactly 150° C. To find this pressure we look to the steam tables in order to find the pressure of saturated steam at the desired temperature, in this case it is 476.16 kPa.
Step 2
To solve part (b) we need to find the weight needed to exactly counter the steam pressure trying to escape the vent. Since force is pressure multiplied by area we must determine the area of the vent:
![]()
Then we multiply this value by the pressure found in part (a) to find the weight required and divide by g to find the mass required to create that weight:
![]()
Step 3
For part (c) we will use the formula for x as a ratio of specific volumes listed above:
![]()
We obtain the values of vf and vg from the steam tables and calculate v from the volume of the pressure cooker and the total mass of the water:
![]()
Plugging these values into our equation for x we obtain:
![Rendered by QuickLaTeX.com \[x=\frac{0.0025\frac{m^3}{kg}-0.00109\frac{m^3}{kg}}{0.39136\frac{m^3}{kg}}=0.003603\]](https://pressbooks.pub/app/uploads/quicklatex/quicklatex.com-106cb519bf5ceedb5b732b52d95cdeea_l3.png)
Step 4
The solution for part (d) brings us back to the steam tables once again. This time we are looking at the specific enthalpy of saturated steam at our given temperature, which in this case is listed as 2113.7 ![]() . We then have to multiply this value by the total mass of water (4kg) to find the total required energy:
. We then have to multiply this value by the total mass of water (4kg) to find the total required energy:
![]()
And finally we need to divide that energy by the heat input of the burner (7000W) to find the time required to transfer the required energy to the water:
![]()
Ideal Gas Equation of State
Continuing on our discussion of pure substances,
we find that for a pure substance in the superheated region at specific volumes
much higher than the critical point, the P-v-T relation can be
conveniently expressed very accurately by the Ideal Gas Equation of State
as follows:
![]()
where: R is constant for a particular substance and is called the Gas Constant.
Note that for the ideal gas equation both the pressure P and the temperature T must be expressed in absolute quantities.
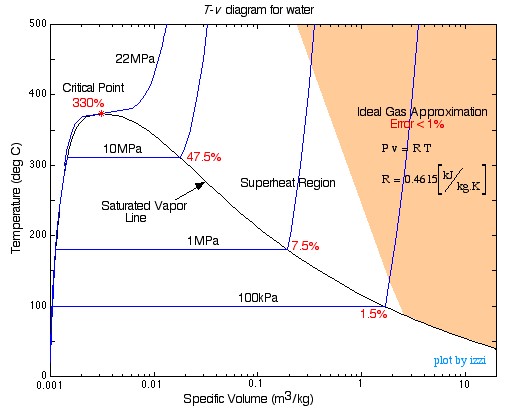
Consider for example the T-v diagram for water as shown below:
![]()
![]()
![]()
![]()
![]()
![]()
![]()
![]()
![]()
![]()
![]()
![]()
![]()
![]()
The shaded zone in the diagram indicates the region that can be represented by the Ideal Gas equation to an error of less than 1%. Note that at the critical point the error is 330%.
![]()
where: ![]() is the Universal Gas Constant and
is the Universal Gas Constant and
![]() is the molar mass of the substance.
is the molar mass of the substance.
For Air: ![]()
Steam: ![]()
The three commonly used formats to express the Ideal Gas Equation of State are:
![]()
![]()
![]()
Solved Example
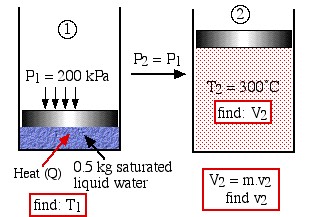
A piston-cylinder device contains 0.5 kg saturated liquid water at a pressure of 200 kPa. Heat is added and the steam expands at constant pressure until it reaches 300°C.
- Draw a diagram representing the process showing the initial and final states of the system.
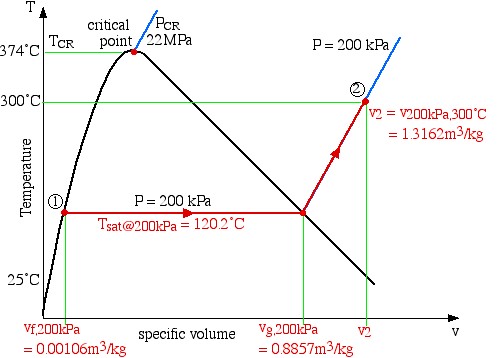
- Sketch this process on a T-v (temperature-specific volume) diagram with respect to the saturation lines, critical point, and relevant constant pressure lines, clearly indicating the initial and final states.
- Using steam tables determine the initial temperature of the steam prior to heating.
- Using steam tables determine the final volume of the steam after heating
- Using the ideal gas equation of state determine the final volume of the steam after heating. Determine the percentage error of using this method compared to that of using the steam tables.
Note: The critical point data and the ideal gas constant for steam can be found on the first page of the steam tables.
Solution Approach:
Even if questions a) and b) were not required, this should always be the first priority item in solving a thermodynamic problem.
![]()
![]()
![]()
![]()
![]()
![]()
![]()
![]()
![]()
![]()
![]()
![]()
![]()
![]()
![]()
![]()
![]()
![]()
![]()
![]()
![]()
![]()
c) Since state (1) is specified as saturated liquid at 200 kPa, we use the saturated pressure steam tables to determine that T1 = Tsat@200kPa = 120.2°C.
d) From the T-v diagram we determine that state (2) is in the superheated region, thus we use the superheated steam tables to determine that v2 ![]() v200kPa,300°C
v200kPa,300°C![]() . Thus V2
. Thus V2 ![]() (658 liters).
(658 liters).
e) Determine V2 from the Ideal Gas Equation of State
![]() T MUST be absolute!
T MUST be absolute!
![]()
Note that in doing a units check, we find that the following conversion appears so often that we feel it should be added to our Units Conversion Survival Kit (recall Chapter 1):
![]()
Finally we determine the percentage error of using the ideal gas equation at state (2):
error%![]()
![]()
Non Ideal Gas Behaviour
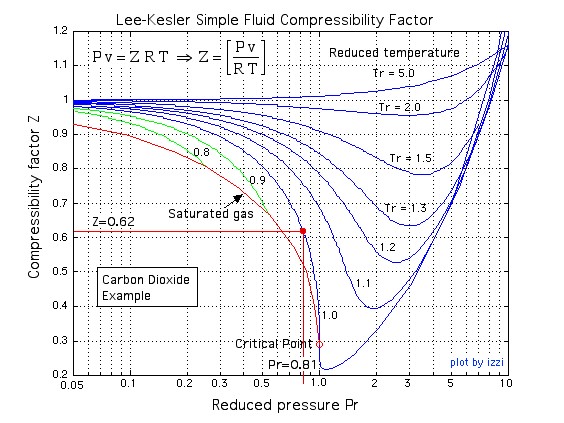
We noticed in the above T-v diagram for water that the gasses can deviate significantly from the ideal gas equation of state in regions nearby the critical point and there have been many equations of state recommended for use to account for this non-ideal behaviour. However, this non-ideal behaviour can be accounted for by a correction factor called the Compressibility Factor Z defined as follows:
![]()
thus when the compressibility factor Z approaches 1 the gas behaves as an ideal gas. Note that under the same conditions of temperature and pressure, the compressibility factor can be expressed as:
![]()
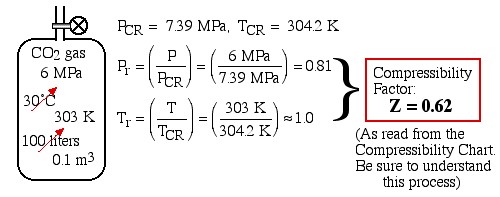
Different fluids have different values of critical point pressure and temperature data PCR and TCR, and these can be determined from the Table of Critical Point Data of Various Substances. Fortunately the Principle of Corresponding States shows that we can normalize the pressure and temperature values with the critical values as follows:
![]()
![]()
All fluids normalized in this manner exhibit similar non-ideal gas behaviour within a few percent, thus they can all be plotted on a Generalized Compressibility Chart. A number of these charts are available, however we prefer to use the Lee-Kesler (logarithmic) Compressibility Chart. The use of the compressibility chart is shown in the following example.
Solved Example
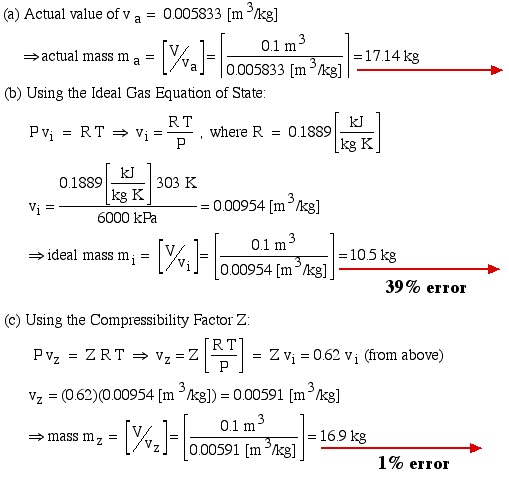
Carbon Dioxide gas is stored in a 100 liter tank at 6 MPa and 30°C. Determine the mass of CO2 in the tank based on (a) values obtained from the CO2 tables of data, (b) the ideal gas equation of state, and (c) the generalized compressibility chart. Compare (b) and (c) to (a) and determine the percentage error in each case.
Solution Approach:
We first determine the Critical Point data for CO2 from the Table of Critical Point Data of Various Substances
![]()
![]()
![]()
![]()
![]()
![]()
![]()

After evaluating the Reduced Pressure and Reduced Temperature we plot them on the Generalized Compressibility Chart in order to determine the Compressibility Factor, as shown below
![]()
![]()
![]()
![]()
![]()
![]()
![]()
![]()
![]()
The actual value of specific va is obtained from the CO2 Superheat Tables.
![]()
![]()
![]()
![]()
![Rendered by QuickLaTeX.com v_i = \dfrac{0.1889\left[\dfrac{\si\kJ}{\si{kg \ K}}\right] 303 \ \si\K}{6000 \ \si\kPa} = 0.00954 \left[\si\m^3/\si\kg\right]](https://pressbooks.pub/app/uploads/quicklatex/quicklatex.com-a782a4cba772da42b56c45c4481ffecf_l3.png)
![]()
![]()
![]()
![]()
![]()
![]()
![]()
The general rule is that if P << PCR or if T >> TCR then you are probably dealing with an ideal gas. If in doubt always check the Compressibility Factor Z on the Compressibility Chart.
